I was working with a small business which faced a big quality control issue problem. Customers were complaining, and we couldn’t find the problem. That’s when I decided to introduce fishbone diagrams. It helped us find the real causes of our problems, making our products much better.
In this guide, I’ll talk about my experience with the fishbone diagrams. It’s a great way to solve complex problems. Whether you’re dealing with production issues, service problems, or anything else, this tool can help you a lot.
Understanding Fishbone Diagrams
Fishbone diagrams, also known as the Ishikawa diagram, is a powerful tool for brainstorming and analyzing causes and effects. It’s great for breaking down complex problems into simpler parts.
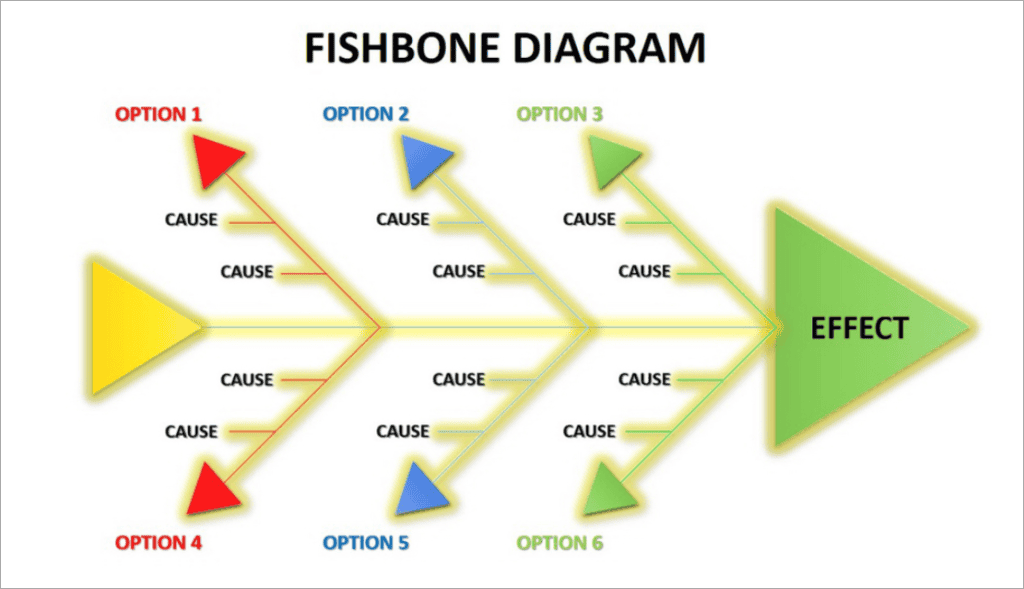
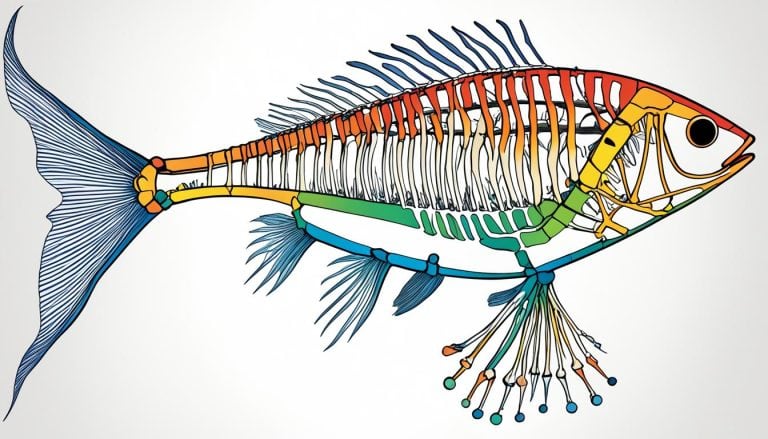
Kaoru Ishikawa, a Japanese quality control expert, created this method in the 1960s. The name “fishbone” comes from its unique shape, like a fish skeleton with the main problem at the head and causes branching off.

This visual tool helps teams find and organize possible causes of a problem. It’s great for solving problems together, as it makes sure everyone’s ideas are heard.
The basic structure includes:
- Problem statement (fish head)
- Main categories (primary bones)
- Potential causes (secondary bones)
Using this method, teams can look into root causes and come up with specific solutions. The fishbone diagram is great at showing complex relationships. It’s a key tool for deep cause and effect analysis.
| Aspect | Fishbone Diagram |
|---|---|
| Primary use | Root Cause Analysis |
| Visual style | Fish skeleton |
| Main components | Problem, categories, causes |
| Key benefit | Structured brainstorming |
When to Use a Fishbone Diagram
Fishbone diagrams can be used in many situations across different fields.
In manufacturing: they help spot the main causes of product flaws or equipment failures. This tool is key for quality management, making complex issues clear for teams.
In healthcare: these diagrams are great for looking into patient safety or better treatment results. They break down tough problems into smaller parts. This makes them perfect for improving processes.
Service businesses: can gain a lot from them too. I suggest using fishbone diagrams for customer satisfaction or making operations smoother. They’re great for solving problems with many possible causes.
- Analyzing recurring quality issues
- Investigating equipment breakdowns
- Improving customer service processes
- Addressing employee retention problems
When I’m dealing with a big problem needing a detailed solution, I go for the fishbone diagram. It’s a great way to get the team involved, spark ideas, and find the unseen factors.
Steps to Create a Fishbone Diagram
Let me walk you through it step by step in creating a Fishbone Diagram. Start by clearly defining the problem and writing it at the “head” of the fish. Then, list the main categories of potential causes, which will be the main “bones” of your diagram.
Next, it’s time for visual brainstorming. Get your team together and ask everyone to share ideas for each category. Write these ideas as smaller “bones” off the main ones. This method helps reveal factors you might have missed.
After you’ve shared all your ideas, analyze the diagram. Look for patterns or common themes. Causes that show up often are usually the most important to focus on.
| Step | Action | Purpose |
|---|---|---|
| 1 | Problem Definition | Focus the analysis |
| 2 | Category Identification | Structure the diagram |
| 3 | Cause Brainstorming | Generate ideas |
| 4 | Diagram Organization | Visualize relationships |
| 5 | Root Cause Analysis | Identify key issues |
Remember, the key to making a good fishbone diagram is teamwork and being open-minded. Make sure everyone on your team is involved for the best outcomes.
Main Categories in a Fishbone Diagram
In my work with Fishbones, I’ve learned that knowing the main categories is key. The 6M’s framework is at the heart of most fishbone diagrams. It offers a full way to improve processes.
- Man: Focuses on human factors affecting the problem
- Machine: Examines equipment and technology issues
- Method: Analyzes processes and procedures
- Material: Looks at raw materials and inputs
- Measurement: Considers data collection and analysis
- Environment: Evaluates external factors impacting the issue
I’ve made a table to show how these categories work in different fields:
| Category | Manufacturing | Healthcare | IT Services |
|---|---|---|---|
| Man | Operator training | Nurse staffing | Developer skills |
| Machine | Equipment maintenance | Medical devices | Server performance |
| Method | Assembly line process | Patient care protocols | Software development lifecycle |
| Material | Raw material quality | Medication supply | Code libraries |
| Measurement | Quality control metrics | Patient vital signs | System uptime tracking |
| Environment | Factory temperature | Hospital cleanliness | Office ergonomics |
By looking at these categories, I can find the main causes and improve processes in many areas.
Best Practices for Effective Fishbone Analysis
Successful fishbone analysis needs careful planning and execution. Start by gathering a diverse team. Include members from different departments to bring unique perspectives to the problem-solving process.
Encourage open communication and creative thinking during discussions. Visual brainstorming can spark new ideas and connections. Use sticky notes or digital tools to capture and organize thoughts on the diagram.
After listing potential causes, prioritize them by impact and feasibility. Focus on the root causes most likely to lead to big improvements. Validate your findings by gathering data and conducting experiments when possible.
Integrating fishbone diagrams into your quality management system boosts problem-solving efforts. Use the insights to develop targeted action plans and track progress over time.
| Best Practice | Description | Benefit |
|---|---|---|
| Diverse Team | Include members from various departments | Broader perspective on problem causes |
| Visual Brainstorming | Use sticky notes or digital tools | Encourages creativity and idea generation |
| Prioritize Causes | Focus on high-impact, feasible solutions | Efficient use of resources |
| Validate Findings | Gather data and conduct experiments | Ensures accuracy of root cause identification |
By following these best practices, you’ll make your fishbone analysis more effective. This will drive meaningful improvements in your processes and products.
Common Mistakes to Avoid in Fishbone Diagramming
Using fishbone diagrams for problem-solving can lead to common errors. One mistake is missing key categories. It’s vital to think about all factors that could cause the problem. Skipping steps can mean missing chances for better processes.
Another mistake is making quick decisions without enough research. The fishbone diagram aims to deeply explore all possible causes. Not checking causes can lead to solutions that don’t work. It’s key to back up each cause with data and evidence.
To keep your fishbone analysis fair, work with a team with varied views. This helps avoid bias and looks at the issue from all angles. The aim is to find the real root causes, not just the symptoms.
| Common Mistake | Impact | Prevention Strategy |
|---|---|---|
| Overlooking categories | Incomplete analysis | Use a standardized category list |
| Jumping to conclusions | Ineffective solutions | Gather evidence for each cause |
| Failing to validate causes | Wasted resources | Conduct follow-up investigations |
Avoiding these errors can make fishbone diagrams more effective in finding root causes. This tool, used right, can bring big improvements in many fields.
Digital Tools for Creating Fishbone Diagrams

I’m excited to share some great digital tools for creating fishbone diagrams. These tools have evolved from traditional pen and paper. Now, we have powerful software that makes cause and effect analysis easy.
I Often like to jump straight in root cause using big sheets of paper or a white board. There is however some tried and tested solutions on the market,
Lucidchart is a user-friendly choice. It offers templates and drag-and-drop features for quick diagram creation. For teams, Microsoft Visio provides robust collaboration capabilities. Both tools let you easily share your work with colleagues.
If you’re looking for a free option, Canva has simple fishbone diagram templates. While not as feature-rich, it’s perfect for basic needs. For those who prefer working offline, SmartDraw offers a desktop version with a wide range of customization options.
Each tool brings something unique to the table. By choosing the right one, you’ll streamline your root cause analysis process.


